-
Crown Castle Reports Second Quarter 2023 Results and Updates Outlook for Full Year 2023
المصدر: Nasdaq GlobeNewswire / 19 يوليو 2023 16:15:01 America/New_York
HOUSTON, July 19, 2023 (GLOBE NEWSWIRE) -- Crown Castle Inc. (NYSE: CCI) ("Crown Castle") today reported results for the second quarter ended June 30, 2023 and updated its full year 2023 outlook, as reflected in the table below.
(dollars in millions, except per share amounts) Current Full
Year 2023
Outlook(a)(b)Full Year
2022 Actual% Change Previous Full
Year 2023
Outlook(c)Current
Compared to
Previous
OutlookSite rental revenues $6,511 $6,289 4% $6,511 —% Net income (loss) $1,581 $1,675 (6)% $1,636 (3)% Net income (loss) per share—diluted $3.64 $3.86 (6)% $3.76 (3)% Adjusted EBITDA(d) $4,422 $4,340 2% $4,472 (1)% AFFO(d) $3,279 $3,200 2% $3,319 (1)% AFFO per share(d) $7.54 $7.38 2% $7.63 (1)% (a) Reflects midpoint of full year 2023 Outlook as issued on July 19, 2023. (b) Net income (loss) outlook, including on a per share basis, includes the benefit of contemplated cost reductions discussed further below, but does not reflect charges, which we expect to be material, associated with certain of such cost reductions due to current uncertainty regarding timing and amounts of such charges. Such charges are expected to be non-recurring and therefore excluded from AFFO and Adjusted EBITDA outlook. (c) Reflects midpoint of full year 2023 Outlook as issued on April 19, 2023. (d) See "Non-GAAP Measures and Other Information" for further information and reconciliation of non-GAAP financial measures to net income (loss), including on a per share basis.
"We delivered second quarter results in line with our expectations and continue to be excited by the long-term opportunity ahead with the majority of the 5G deployment in the U.S. still to come," stated Jay Brown, Crown Castle's Chief Executive Officer. "As the carriers have reduced network spending, we anticipate lower tower activity for the remainder of this year, resulting in lower contribution from services and a decrease to our full year 2023 outlook. Due to the long-term leasing agreements we have entered into with our customers, this reduction in tower activity is expected to have little impact on our site rental revenues.""Expected growth in our core business in 2023 remains robust, including 5% tower organic growth, 10,000 small cell node deployments and returning to 3% fiber solutions growth by the end of the year. Longer term, as our customers spend to meet the significant increase in mobile data demand in the U.S, we have visibility to continued growth in our core business, with 75% of our expected 5% annual tower organic growth contracted through 2027 when normalized for the previously disclosed legacy Sprint rationalization in 2025. Augmenting that growth, we anticipate double-digit annual revenue growth in our small cell business over the next several years as we execute on our existing small cell backlog of 60,000 nodes, providing support for our expectation of returning to our long-term annual dividend per share growth target of 7% to 8% beyond 2025."
RESULTS FOR THE QUARTER
The table below sets forth select financial results for the quarters ended June 30, 2023 and June 30, 2022.(dollars in millions, except per share amounts) Q2 2023 Q2 2022 Change % Change Site rental revenues $1,728 $1,567 $161 10% Net income (loss) $455 $421 $34 8% Net income (loss) per share—diluted $1.05 $0.97 $0.08 8% Adjusted EBITDA(a) $1,188 $1,078 $110 10% AFFO(a) $891 $783 $108 14% AFFO per share(a) $2.05 $1.80 $0.25 14% (a) See "Non-GAAP Measures and Other Information" for further information and reconciliation of non-GAAP financial measures to net income (loss), including on a per share basis. HIGHLIGHTS FROM THE QUARTER
- Site rental revenues. Site rental revenues grew 10%, or $161 million, from second quarter 2022 to second quarter 2023, inclusive of approximately $155 million in Organic Contribution to Site Rental Billings, a $30 million decrease in straight-lined revenues, and a $36 million increase in amortization of prepaid rent. The $155 million in Organic Contribution to Site Rental Billings represents 11.9% growth, or 4.2% when adjusted for the impact of Sprint Cancellations described below.
- Sprint Cancellations. Included in site rental revenues is a $100 million net contribution to Site Rental Billings from lease cancellations related to the previously disclosed T-Mobile and Sprint network consolidation ("Sprint Cancellations"), consisting of $97 million to small cells and $3 million to fiber solutions. Also included in site rental revenues is $57 million in accelerated prepaid rent amortization associated with Sprint Cancellations related to small cells.
- Net income. Net income for the second quarter 2023 was $455 million compared to $421 million for the second quarter 2022.
- Adjusted EBITDA. Second quarter 2023 Adjusted EBITDA was $1.2 billion compared to $1.1 billion for the second quarter 2022, representing 10% growth. The growth in the quarter was primarily as a result of $155 million of organic growth, inclusive of $100 million net contribution from Sprint Cancellations, partially offset by lower services contribution.
- AFFO and AFFO per share. Second quarter 2023 AFFO was $891 million, or $2.05 per share, representing growth from the second quarter 2022 of 14% for each.
- Capital expenditures. Capital expenditures during the quarter were $379 million, comprised of $18 million of sustaining capital expenditures and $361 million of discretionary capital expenditures. Discretionary capital expenditures during the quarter primarily included approximately $298 million attributable to Fiber and approximately $57 million attributable to Towers.
- Common stock dividend. During the quarter, Crown Castle paid common stock dividends of approximately $678 million in the aggregate, or $1.565 per common share, an increase of 6.5% on a per share basis compared to the same period a year ago.
- Financing activity. In April 2023, Crown Castle issued $1.35 billion in aggregate principal of senior unsecured notes in a combination of 5-year and 10-year maturities with a weighted average maturity and coupon of 8 years and approximately 5.0%, respectively. Net proceeds from the offering were used to repay a portion of the indebtedness under the existing revolving credit facility and pay related fees and expenses.
"Our full year 2023 outlook for site rental revenues is unchanged despite anticipated slower tower activity in the second half of this year," stated Dan Schlanger, Crown Castle's Chief Financial Officer. "The resiliency in organic growth is the result of our past decisions to reduce the risk in our business by entering into attractive long-term customer agreements with contracted increases. Due to the change in tower activity, we have lowered our expected contribution from tower services margin by $90 million which reflects lower expected services revenues, partially offset by expected reductions in expenses. We believe the combination of the stability of our contracted rental revenues, efficient operations, and strong balance sheet provides a resilient cash flow stream. To improve the strength of our balance sheet, we issued $1.35 billion of long-term fixed rate debt in the second quarter at a weighted average interest rate of approximately 5%, allowing us to end the second quarter with more than 90% fixed rate debt, a weighted average maturity of 8 years with only 7% of our debt maturing through 2024, and more than $6 billion of available liquidity under our revolving credit facility."
OUTLOOK
This Outlook section contains forward-looking statements, and actual results may differ materially. Information regarding potential risks which could cause actual results to differ from the forward-looking statements herein is set forth below and in Crown Castle's filings with the SEC.The following table sets forth Crown Castle's current full year 2023 Outlook which has been updated to reflect lower expected tower activity through the remainder of the year and higher expected interest expense, partially offset by expected lower expenses, interest income increases and lower sustaining capital expenditures.
(in millions, except per share amounts) Full Year 2023(a)(b) Change to Midpoint
from Previous
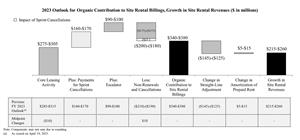
Outlook(c)Site rental billings(d) $5,631 to $5,671 $— Amortization of prepaid rent $570 to $580 $— Straight-lined revenues $264 to $284 $— Site rental revenues $6,488 to $6,533 $— Site rental costs of operations(e) $1,633 to $1,678 -$10 Services and other gross margin $120 to $150 -$90 Net income (loss) $1,541 to $1,621 -$55 Net income (loss) per share—diluted $3.54 to $3.73 -$0.13 Adjusted EBITDA(f) $4,399 to $4,444 -$50 Depreciation, amortization and accretion $1,712 to $1,807 $— Interest expense and amortization of deferred financing costs, net(g) $834 to $869 +$15 FFO(f) $3,295 to $3,330 -$60 AFFO(f) $3,261 to $3,296 -$40 AFFO per share(f) $7.50 to $7.58 -$0.09 (a) As issued on July 19, 2023. (b) Net income (loss) outlook, including on a per share basis, includes the benefit of contemplated cost reductions discussed further below, but does not reflect charges, which we expect to be material, associated with certain of such cost reductions due to current uncertainty regarding timing and amounts of such charges. Such charges are expected to be non-recurring and therefore excluded from AFFO and Adjusted EBITDA outlook. (c) As issued on April 19, 2023. (d) See "Non-GAAP Measures and Other Information" for our definition of site rental billings. (e) Exclusive of depreciation, amortization and accretion. (f) See "Non-GAAP Measures and Other Information" for further information and reconciliation of non-GAAP financial measures to net income (loss), including on a per share basis. (g) See "Non-GAAP Measures and Other Information" for the reconciliation of "Outlook for Components of Interest Expense." - The chart below reconciles the components of expected growth in site rental revenues from 2022 to 2023 of $215 million to $260 million, inclusive of expected Organic Contributions to Site Rental Revenues of $340 million to $380 million, or 7%, which is unchanged from the previous Outlook. The expected consolidated growth includes 5% from towers, 25% from small cells and 5% from fiber solutions. Adjusted for the expected impact from Sprint Cancellations, the projected consolidated growth of 4% includes 5% from towers, 8% from small cells, and flat fiber solutions revenue.
- The full year 2023 Outlook for core leasing activity has decreased by $10 million from the previous Outlook, reflecting lower tower activity expected in the second half of 2023. This reduction in core leasing activity is offset by a $10 million reduction to the full year 2023 Outlook for non-renewals and cancellations, consisting of $5 million of lower towers non-renewals and $5 million of lower cancellations due to timing of small cell cancellations that occurred in the second quarter.
- In total, core leasing activity is expected to contribute $275 million to $305 million, comprised of $125 million to $135 million from towers (compared to $135 million to $145 million in the previous Outlook), with small cell and fiber solutions core leasing activity unchanged at $30 million to $40 million and $120 million to $130 million, respectively.
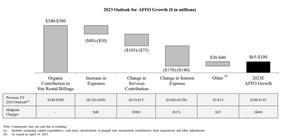
- The chart below reconciles the components of expected growth in AFFO from 2022 to 2023 of $65 million to $100 million.
- The full year 2023 Outlook for expected contribution from services is $90 million lower than the previous Outlook as a result of lower expected tower activity in the second half of the year, partially offset by $40 million in expected decrease in expenses across site rental cost of operations and selling, general and administrative expenses also expected in the second half of 2023.
- Interest expense for full year 2023 is expected to be $15 million higher than the previous Outlook related to higher expected interest rates, offset by $10 million of higher expected interest income and $15 million of lower sustaining capital expenditures.
Additional information is available in Crown Castle's quarterly Supplemental Information Package posted in the Investors section of our website.
CONFERENCE CALL DETAILS
Crown Castle has scheduled a conference call for Thursday, July 20, 2023, at 10:30 a.m. Eastern time to discuss its second quarter 2023 results. A listen only live audio webcast of the conference call, along with supplemental materials for the call, can be accessed on the Crown Castle website at https://investor.crowncastle.com. Participants may join the conference call by dialing 833-816-1115 (Toll Free) or 412-317-0694 (International) at least 30 minutes prior to the start time. All dial-in participants should ask to join the Crown Castle call.A replay of the webcast will be available on the Investor page of Crown Castle's website until end of day, Saturday, July 20, 2024.
ABOUT CROWN CASTLE
Crown Castle owns, operates and leases more than 40,000 cell towers and approximately 85,000 route miles of fiber supporting small cells and fiber solutions across every major U.S. market. This nationwide portfolio of communications infrastructure connects cities and communities to essential data, technology and wireless service - bringing information, ideas and innovations to the people and businesses that need them. For more information on Crown Castle, please visit www.crowncastle.com.Non-GAAP Measures and Other Information
This press release includes presentations of Adjusted EBITDA, Adjusted Funds from Operations ("AFFO"), including per share amounts, Funds from Operations ("FFO"), including per share amounts, Organic Contribution to Site Rental Billings, including as Adjusted for Impact of Sprint Cancellations, and Net Debt, which are non-GAAP financial measures. These non-GAAP financial measures are not intended as alternative measures of operating results or cash flow from operations (as determined in accordance with Generally Accepted Accounting Principles ("GAAP")).
Our non-GAAP financial measures may not be comparable to similarly titled measures of other companies, including other companies in the communications infrastructure sector or other real estate investment trusts ("REITs").
In addition to the non-GAAP financial measures used herein, we also provide segment site rental gross margin, segment services and other gross margin and segment operating profit, which are key measures used by management to evaluate our operating segments. These segment measures are provided pursuant to GAAP requirements related to segment reporting. In addition, we provide the components of certain GAAP measures, such as site rental revenues and capital expenditures.
Our non-GAAP financial measures are presented as additional information because management believes these measures are useful indicators of the financial performance of our business. Among other things, management believes that:
- Adjusted EBITDA is useful to investors or other interested parties in evaluating our financial performance. Adjusted EBITDA is the primary measure used by management (1) to evaluate the economic productivity of our operations and (2) for purposes of making decisions about allocating resources to, and assessing the performance of, our operations. Management believes that Adjusted EBITDA helps investors or other interested parties meaningfully evaluate and compare the results of our operations (1) from period to period and (2) to our competitors, by removing the impact of our capital structure (primarily interest charges from our outstanding debt) and asset base (primarily depreciation, amortization and accretion) from our financial results. Management also believes Adjusted EBITDA is frequently used by investors or other interested parties in the evaluation of the communications infrastructure sector and other REITs to measure financial performance without regard to items such as depreciation, amortization and accretion, which can vary depending upon accounting methods and the book value of assets. In addition, Adjusted EBITDA is similar to the measure of current financial performance generally used in our debt covenant calculations. Adjusted EBITDA should be considered only as a supplement to net income (loss) computed in accordance with GAAP as a measure of our performance.
- AFFO, including per share amounts, is useful to investors or other interested parties in evaluating our financial performance. Management believes that AFFO helps investors or other interested parties meaningfully evaluate our financial performance as it includes (1) the impact of our capital structure (primarily interest expense on our outstanding debt and dividends on our preferred stock (in periods where applicable)) and (2) sustaining capital expenditures, and excludes the impact of our (1) asset base (primarily depreciation, amortization and accretion) and (2) certain non-cash items, including straight-lined revenues and expenses related to fixed escalations and rent free periods. GAAP requires rental revenues and expenses related to leases that contain specified rental increases over the life of the lease to be recognized evenly over the life of the lease. In accordance with GAAP, if payment terms call for fixed escalations or rent free periods, the revenues or expenses are recognized on a straight-lined basis over the fixed, non-cancelable term of the contract. Management notes that Crown Castle uses AFFO only as a performance measure. AFFO should be considered only as a supplement to net income (loss) computed in accordance with GAAP as a measure of our performance and should not be considered as an alternative to cash flow from operations or as residual cash flow available for discretionary investment.
- FFO, including per share amounts, is useful to investors or other interested parties in evaluating our financial performance. Management believes that FFO may be used by investors or other interested parties as a basis to compare our financial performance with that of other REITs. FFO helps investors or other interested parties meaningfully evaluate financial performance by excluding the impact of our asset base (primarily real estate depreciation, amortization and accretion). FFO is not a key performance indicator used by Crown Castle. FFO should be considered only as a supplement to net income (loss) computed in accordance with GAAP as a measure of our performance and should not be considered as an alternative to cash flow from operations.
- Organic Contribution to Site Rental Billings is useful to investors or other interested parties in understanding the components of the year-over-year changes in our site rental revenues computed in accordance with GAAP. Management uses Organic Contribution to Site Rental Billings to assess year-over-year growth rates for our rental activities, to evaluate current performance, to capture trends in rental rates, core leasing activities and tenant non-renewals in our core business, as well as to forecast future results. Separately, we are also disclosing Organic Contribution to Site Rental Billings as Adjusted for Impact of Sprint Cancellations, which is outside of ordinary course, to provide further insight into our results of operations and underlying trends. Management believes that identifying the impact for Sprint Cancellations provides increased transparency and comparability across periods. Organic Contribution to Site Rental Billings (including as Adjusted for Impact of Sprint Cancellations) is not meant as an alternative measure of revenue and should be considered only as a supplement in understanding and assessing the performance of our site rental revenues computed in accordance with GAAP.
- Net Debt is useful to investors or other interested parties in evaluating our overall debt position and future debt capacity. Management uses Net Debt in assessing our leverage. Net Debt is not meant as an alternative measure of debt and should be considered only as a supplement in understanding and assessing our leverage.
Non-GAAP Financial Measures
Adjusted EBITDA. We define Adjusted EBITDA as net income (loss) plus restructuring charges (credits), asset write-down charges, acquisition and integration costs, depreciation, amortization and accretion, amortization of prepaid lease purchase price adjustments, interest expense and amortization of deferred financing costs, net, (gains) losses on retirement of long-term obligations, net (gain) loss on interest rate swaps, (gains) losses on foreign currency swaps, impairment of available-for-sale securities, interest income, other (income) expense, (benefit) provision for income taxes, cumulative effect of a change in accounting principle and stock-based compensation expense, net.
AFFO. We define AFFO as FFO before straight-lined revenues, straight-lined expenses, stock-based compensation expense, net, non-cash portion of tax provision, non-real estate related depreciation, amortization and accretion, amortization of non-cash interest expense, other (income) expense, (gains) losses on retirement of long-term obligations, net (gain) loss on interest rate swaps, (gains) losses on foreign currency swaps, impairment of available-for-sale securities, acquisition and integration costs, restructuring charges (credits), cumulative effect of a change in accounting principle and adjustments for noncontrolling interests, less sustaining capital expenditures.
AFFO per share. We define AFFO per share as AFFO divided by diluted weighted-average common shares outstanding.
FFO. We define FFO as net income (loss) plus real estate related depreciation, amortization and accretion and asset write-down charges, less noncontrolling interest and cash paid for preferred stock dividends (in periods where applicable), and is a measure of funds from operations attributable to common stockholders.
FFO per share. We define FFO per share as FFO divided by diluted weighted-average common shares outstanding.
Organic Contribution to Site Rental Billings. We define Organic Contribution to Site Rental Billings as the sum of the change in site rental revenues related to core leasing activity, escalators and payments for Sprint Cancellations (for periods beginning in 2023), less non-renewals of tenant contracts and non-renewals associated with Sprint Cancellations (for periods beginning in 2023). Additionally, Organic Contribution to Site Rental Billings as Adjusted for Impact of Sprint Cancellations reflects Organic Contribution to Site Rental Billings less payments for Sprint Cancellations, plus non-renewals associated with Sprint Cancellations.
Net Debt. We define Net Debt as (1) debt and other long-term obligations and (2) current maturities of debt and other obligations, excluding unamortized adjustments, net; less cash, cash equivalents and restricted cash.
Segment Measures
Segment site rental gross margin. We define segment site rental gross margin as segment site rental revenues less segment site rental costs of operations, excluding stock-based compensation expense, net and amortization of prepaid lease purchase price adjustments recorded in consolidated site rental costs of operations.
Segment services and other gross margin. We define segment services and other gross margin as segment services and other revenues less segment services and other costs of operations, excluding stock-based compensation expense, net recorded in consolidated services and other costs of operations.
Segment operating profit. We define segment operating profit as segment site rental gross margin plus segment services and other gross margin, less segment selling, general and administrative expenses.
All of these measurements of profit or loss are exclusive of depreciation, amortization and accretion, which are shown separately. Additionally, certain costs are shared across segments and are reflected in our segment measures through allocations that management believes to be reasonable.
Other Definitions
Site rental billings. We define site rental billings as site rental revenues exclusive of the impacts from (1) straight-lined revenues, (2) amortization of prepaid rent in accordance with GAAP and (3) contribution from recent acquisitions until the one-year anniversary of such acquisitions.
Core leasing activity. We define core leasing activity as site rental revenues growth from tenant additions across our entire portfolio and renewals or extensions of tenant contracts, exclusive of (1) the impacts from both straight-lined revenues and amortization of prepaid rent in accordance with GAAP and (2) payments for Sprint Cancellations, where applicable.
Non-renewals. We define non-renewals of tenant contracts as the reduction in site rental revenues as a result of tenant churn, terminations and, in limited circumstances, reductions of existing lease rates, exclusive of non-renewals associated with Sprint Cancellations, where applicable.
Discretionary capital expenditures. We define discretionary capital expenditures as those capital expenditures made with respect to activities which we believe exhibit sufficient potential to enhance long-term stockholder value. They primarily consist of expansion or development of communications infrastructure (including capital expenditures related to (1) enhancing communications infrastructure in order to add new tenants for the first time or support subsequent tenant equipment augmentations or (2) modifying the structure of a communications infrastructure asset to accommodate additional tenants) and construction of new communications infrastructure. Discretionary capital expenditures also include purchases of land interests (which primarily relates to land assets under towers as we seek to manage our interests in the land beneath our towers), certain technology-related investments necessary to support and scale future customer demand for our communications infrastructure, and other capital projects.
Sustaining capital expenditures. We define sustaining capital expenditures as those capital expenditures not otherwise categorized as discretionary capital expenditures, such as (1) maintenance capital expenditures on our communications infrastructure assets that enable our tenants' ongoing quiet enjoyment of the communications infrastructure and (2) ordinary corporate capital expenditures.
Reconciliation of Historical Adjusted EBITDA:
For the Three Months Ended For the Six Months Ended For the Twelve Months Ended (in millions; totals may not add due to rounding) June 30, 2023 June 30, 2022 June 30, 2023 June 30, 2022 December 31, 2022 Net income (loss) $ 455 $ 421 $ 874 $ 842 $ 1,675 Adjustments to increase (decrease) net income (loss): Asset write-down charges 22 9 22 23 34 Acquisition and integration costs 1 1 1 1 2 Depreciation, amortization and accretion 445 427 876 847 1,707 Amortization of prepaid lease purchase price adjustments 4 4 8 8 16 Interest expense and amortization of deferred financing costs, net(a) 208 165 410 329 699 (Gains) losses on retirement of long-term obligations — — — 26 28 Interest income (5 ) — (7 ) (1 ) (3 ) Other (income) expense 2 2 4 4 10 (Benefit) provision for income taxes 7 5 14 11 16 Stock-based compensation expense, net 50 44 91 83 156 Adjusted EBITDA(b)(c) $ 1,188 $ 1,078 $ 2,292 $ 2,173 $ 4,340 Reconciliation of Current Outlook for Adjusted EBITDA:
Full Year 2023 (in millions; totals may not add due to rounding) Outlook(e)(f) Net income (loss) $1,541 to $1,621 Adjustments to increase (decrease) net income (loss): Asset write-down charges $26 to $36 Acquisition and integration costs $0 to $8 Depreciation, amortization and accretion $1,712 to $1,807 Amortization of prepaid lease purchase price adjustments $15 to $17 Interest expense and amortization of deferred financing costs, net(d) $834 to $869 (Gains) losses on retirement of long-term obligations $0 to $0 Interest income $(14) to $(13) Other (income) expense $2 to $7 (Benefit) provision for income taxes $16 to $24 Stock-based compensation expense, net $165 to $169 Adjusted EBITDA(b)(c) $4,399 to $4,444 (a) See the reconciliation of "Components of Interest Expense." for a discussion of non-cash interest expense. (b) See discussion and our definition of Adjusted EBITDA in this "Non-GAAP Measures and Other Information." (c) The above reconciliation excludes line items included in our definition which are not applicable for the periods shown. (d) See the reconciliation of "Outlook for Components of Interest Expense" for a discussion of non-cash interest expense. (e) As issued on July 19, 2023. (f) Net income (loss) outlook, including on a per share basis, includes the benefit of contemplated cost reductions discussed above, but does not reflect charges, which we expect to be material, associated with certain of such cost reductions due to current uncertainty regarding timing and amounts of such charges. Such charges are expected to be non-recurring and therefore excluded from AFFO and Adjusted EBITDA outlook. Reconciliation of Historical FFO and AFFO:
For the Three Months Ended For the Six Months Ended For the Twelve Months Ended (in millions; totals may not add due to rounding) June 30, 2023 June 30, 2022 June 30, 2023 June 30, 2022 December 31, 2022 Net income (loss) $ 455 $ 421 $ 874 $ 842 $ 1,675 Real estate related depreciation, amortization and accretion 424 412 841 820 1,653 Asset write-down charges 22 9 22 23 34 FFO(a)(b) $ 901 $ 842 $ 1,737 $ 1,685 $ 3,362 Weighted-average common shares outstanding—diluted 434 434 434 434 434 FFO (from above) $ 901 $ 842 $ 1,737 $ 1,685 $ 3,362 Adjustments to increase (decrease) FFO: Straight-lined revenues (80 ) (120 ) (163 ) (235 ) (410 ) Straight-lined expenses 18 19 39 37 73 Stock-based compensation expense, net 50 44 91 83 156 Non-cash portion of tax provision (6 ) (3 ) 4 2 6 Non-real estate related depreciation, amortization and accretion 21 15 35 27 54 Amortization of non-cash interest expense 4 4 7 7 14 Other (income) expense 2 2 4 4 10 (Gains) losses on retirement of long-term obligations — — — 26 28 Acquisition and integration costs 1 1 1 1 2 Sustaining capital expenditures (18 ) (21 ) (33 ) (42 ) (95 ) AFFO(a)(b) $ 891 $ 783 $ 1,720 $ 1,595 $ 3,200 Weighted-average common shares outstanding—diluted 434 434 434 434 434 (a) See discussion and our definitions of FFO and AFFO in this "Non-GAAP Measures and Other Information." (b) The above reconciliation excludes line items included in our definition which are not applicable for the periods shown. Reconciliation of Historical FFO and AFFO per share:
For the Three Months Ended For the Six Months Ended For the Twelve Months Ended (in millions, except per share amounts; totals may not add due to rounding) June 30, 2023 June 30, 2022 June 30, 2023 June 30, 2022 December 31, 2022 Net income (loss) $ 1.05 $ 0.97 $ 2.01 $ 1.94 $ 3.86 Real estate related depreciation, amortization and accretion 0.98 0.95 1.94 1.89 3.81 Asset write-down charges 0.05 0.02 0.05 0.05 0.08 FFO(a)(b) $ 2.08 $ 1.94 $ 4.00 $ 3.88 $ 7.75 Weighted-average common shares outstanding—diluted 434 434 434 434 434 FFO (from above) $ 2.08 $ 1.94 $ 4.00 $ 3.88 $ 7.75 Adjustments to increase (decrease) FFO: Straight-lined revenues (0.18 ) (0.28 ) (0.38 ) (0.54 ) (0.94 ) Straight-lined expenses 0.04 0.04 0.09 0.09 0.17 Stock-based compensation expense, net 0.12 0.10 0.21 0.19 0.36 Non-cash portion of tax provision (0.01 ) (0.01 ) 0.01 — 0.01 Non-real estate related depreciation, amortization and accretion 0.05 0.03 0.08 0.06 0.13 Amortization of non-cash interest expense 0.01 0.01 0.02 0.02 0.03 Other (income) expense — 0.01 0.01 0.01 0.02 (Gains) losses on retirement of long-term obligations — — — 0.06 0.06 Acquisition and integration costs — 0.01 — — 0.01 Sustaining capital expenditures (0.04 ) (0.05 ) (0.08 ) (0.10 ) (0.22 ) AFFO(a)(b) $ 2.05 $ 1.80 $ 3.96 $ 3.67 $ 7.38 Weighted-average common shares outstanding—diluted 434 434 434 434 434 (a) See discussion and our definitions of FFO and AFFO, including per share amounts in this "Non-GAAP Measures and Other Information." (b) The above reconciliation excludes line items included in our definition which are not applicable for the periods shown. Reconciliation of Current Outlook for FFO and AFFO:
Full Year 2023 Full Year 2023 (in millions, except per share amounts; totals may not add due to rounding) Outlook(a)(b) Outlook per share(a)(b) Net income (loss) $1,541 to $1,621 $3.54 to $3.73 Real estate related depreciation, amortization and accretion $1,666 to $1,746 $3.83 to $4.01 Asset write-down charges $26 to $36 $0.06 to $0.08 FFO(c)(d) $3,295 to $3,330 $7.57 to $7.66 Weighted-average common shares outstanding—diluted 435 435 FFO (from above) $3,295 to $3,330 $7.70 to $7.80 Adjustments to increase (decrease) FFO: Straight-lined revenues $(284) to $(264) $(0.65) to $(0.61) Straight-lined expenses $61 to $81 $0.14 to $0.19 Stock-based compensation expense, net $165 to $169 $0.38 to $0.39 Non-cash portion of tax provision $0 to $8 $0.00 to $0.02 Non-real estate related depreciation, amortization and accretion $47 to $62 $0.11 to $0.14 Amortization of non-cash interest expense $7 to $17 $0.02 to $0.04 Other (income) expense $2 to $7 $0.00 to $0.02 (Gains) losses on retirement of long-term obligations $0 to $0 $0.00 to $0.00 Acquisition and integration costs $0 to $8 $0.00 to $0.02 Sustaining capital expenditures $(88) to $(68) $(0.20) to $(0.16) AFFO(c)(d) $3,261 to $3,296 $7.50 to $7.58 Weighted-average common shares outstanding—diluted 435 435 (a) As issued on July 19, 2023. (b) Net income (loss) outlook, including on a per share basis, includes the benefit of contemplated cost reductions discussed above, but does not reflect charges, which we expect to be material, associated with certain of such cost reductions due to current uncertainty regarding timing and amounts of such charges. Such charges are expected to be non-recurring and therefore excluded from AFFO and Adjusted EBITDA outlook. (c) See discussion and our definitions of FFO and AFFO, including per share amounts in this "Non-GAAP Measures and Other Information." (d) The above reconciliation excludes line items included in our definition which are not applicable for the periods shown. For Comparative Purposes - Reconciliation of Previous Outlook for Adjusted EBITDA:
Previously Issued (in millions; totals may not add due to rounding) Full Year 2023 Outlook(a) Net income (loss) $1,596 to $1,676 Adjustments to increase (decrease) income (loss) from continuing operations: Asset write-down charges $26 to $36 Acquisition and integration costs $0 to $8 Depreciation, amortization and accretion $1,712 to $1,807 Amortization of prepaid lease purchase price adjustments $15 to $17 Interest expense and amortization of deferred financing costs, net(b) $814 to $859 (Gains) losses on retirement of long-term obligations $0 to $0 Interest income $(4) to $(3) Other (income) expense $2 to $7 (Benefit) provision for income taxes $16 to $24 Stock-based compensation expense, net $165 to $169 Adjusted EBITDA(c)(d) $4,449 to $4,494 For Comparative Purposes - Reconciliation of Previous Outlook for FFO and AFFO:
Previously Issued Previously Issued (in millions, except per share amounts; totals may not add due to rounding) Full Year 2023
Outlook(a)Full Year 2023 Outlook
per share(a)Net income (loss) $1,596 to $1,676 $3.67 to $3.85 Real estate related depreciation, amortization and accretion $1,666 to $1,746 $3.83 to $4.01 Asset write-down charges $26 to $36 $0.06 to $0.08 FFO(c)(d) $3,350 to $3,395 $7.70 to $7.80 Weighted-average common shares outstanding—diluted 435 435 FFO (from above) $3,350 to $3,395 $7.70 to $7.80 Adjustments to increase (decrease) FFO: Straight-lined revenues $(284) to $(264) $(0.65) to $(0.61) Straight-lined expenses $61 to $81 $0.14 to $0.19 Stock-based compensation expense, net $165 to $169 $0.38 to $0.39 Non-cash portion of tax provision $0 to $8 $0.00 to $0.02 Non-real estate related depreciation, amortization and accretion $47 to $62 $0.11 to $0.14 Amortization of non-cash interest expense $7 to $17 $0.02 to $0.04 Other (income) expense $2 to $7 $0.00 to $0.02 (Gains) losses on retirement of long-term obligations $0 to $0 $0.00 to $0.00 Acquisition and integration costs $0 to $8 $0.00 to $0.02 Sustaining capital expenditures $(103) to $(83) $(0.24) to $(0.19) AFFO(c)(d) $3,296 to $3,341 $7.58 to $7.68 Weighted-average common shares outstanding—diluted 435 435 (a) As issued on April 19, 2023. (b) See the reconciliation of "Outlook for Components of Interest Expense" for a discussion of non-cash interest expense. (c) See discussion of and our definition of Adjusted EBITDA and FFO and AFFO, including per share amounts in this "Non-GAAP Measures and Other Information." (d) The above reconciliation excludes line items included in our definition which are not applicable for the periods shown. Components of Changes in Site Rental Revenues for the Quarters Ended June 30, 2023 and 2022:
Three Months Ended June 30, (dollars in millions; totals may not add due to rounding) 2023 2022 Components of changes in site rental revenues: Prior year site rental billings(a) $ 1,304 $ 1,245 Core leasing activity(a) 73 75 Escalators 24 22 Non-renewals(a) (42 ) (39 ) Organic Contribution to Site Rental Billings as Adjusted for Impact of Sprint Cancellations(a) 54 58 Payments for Sprint Cancellations(b) 106 — Non-renewals associated with Sprint Cancellations(b) (6 ) — Organic Contribution to Site Rental Billings(a) 155 58 Straight-lined revenues 80 120 Amortization of prepaid rent 188 143 Acquisitions(c) 1 1 Other — — Total site rental revenues $ 1,728 $ 1,567 Year-over-year changes in revenues: Site rental revenues 10.3 % 10.0 % Changes in revenues as a percentage of prior year site rental billings: Organic Contribution to Site Rental Billings as Adjusted for Impact of Sprint Cancellations(a) 4.2 % 4.7 % Organic Contribution to Site Rental Billings(a) 11.9 % 4.7 % (a) See our definitions of site rental billings, core leasing activity, non-renewals, Organic Contribution to Site Rental Billings and Organic Contribution to Site Rental Billings as Adjusted for Impact of Sprint Cancellations in this "Non-GAAP Measures and Other Information." (b) In the second quarter 2023, we received $101 million and $5 million of payments for Sprint Cancellations that relate to small cells and fiber solutions, respectively, and $4 million and $2 million of non-renewals associated with Sprint Cancellations that relate to small cells and fiber solutions, respectively. (c) Represents the contribution from recent acquisitions. The financial impact of recent acquisitions is excluded from Organic Contribution to Site Rental Billings, including as Adjusted for Impact of Sprint Cancellations, until the one-year anniversary of such acquisitions. Components of Changes in Site Rental Revenues for Full Year 2023 Outlook:
(dollars in millions; totals may not add due to rounding) Current Full Year 2023 Outlook(a) Previously Issued Full Year 2023 Outlook(b) Components of changes in site rental revenues: Prior year site rental billings(c) $5,310 $5,310 Core leasing activity(c) $275 to $305 $285 to $315 Escalators $90 to $100 $90 to $100 Non-renewals(c) $(175) to $(155) $(180) to $(160) Organic Contribution to Site Rental Billings as Adjusted for Impact of Sprint Cancellations(c)(d) $205 to $235 $210 to $240 Payments for Sprint Cancellations(d) $160 to $170 $160 to $170 Non-renewals associated with Sprint Cancellations(d) $(25) to $(25) $(30) to $(30) Organic Contribution to Site Rental Billings(c) $340 to $380 $340 to $380 Straight-lined revenues $264 to $284 $264 to $284 Amortization of prepaid rent $570 to $580 $570 to $580 Acquisitions(e) — — Other — — Total site rental revenues $6,488 to $6,533 $6,488 to $6,533 Year-over-year changes in revenues:(f) Site rental revenues 3.5% 3.5% Changes in revenues as a percentage of prior year site rental billings: Organic Contribution to Site Rental Billings as Adjusted for Impact of Sprint Cancellations(c) 4.1% 4.2% Organic Contribution to Site Rental Billings(c) 6.8% 6.8% (a) As issued on July 19, 2023. (b) As issued on April 19, 2023. (c) See our definitions of site rental billings, core leasing activity, non-renewals, Organic Contribution to Site Rental Billings, and Organic Contribution to Site Rental Billings as Adjusted for Impact of Sprint Cancellations in this "Non-GAAP Measures and Other Information." (d) Full year 2023 Outlook reflects approximately $70 million and $100 million of payments for Sprint Cancellations that related to fiber solutions and small cells, respectively, and $10 million and $15 million of non-renewals associated with Sprint Cancellations that related to fiber solutions and small cells, respectively. (e) Represents the contribution from recent acquisitions. The financial impact of recent acquisitions is excluded from Organic Contribution to Site Rental Billings, including as Adjusted for Impact of Sprint Cancellations, until the one-year anniversary of such acquisitions. (f) Calculated based on midpoint of full year Outlook, where applicable. Components of Capital Expenditures:(a)
For the Three Months Ended June 30, 2023 June 30, 2022 (in millions) Towers Fiber Other Total Towers Fiber Other Total Discretionary capital expenditures: Communications infrastructure improvements and other capital projects $ 34 $ 298 $ 6 $ 338 $ 27 $ 235 $ 5 $ 267 Purchases of land interests 23 — — 23 15 — — 15 Sustaining capital expenditures 4 8 6 18 3 12 6 21 Total capital expenditures $ 61 $ 306 $ 12 $ 379 $ 45 $ 247 $ 11 $ 303 For the Six Months Ended June 30, 2023 June 30, 2022 (in millions) Towers Fiber Other Total Towers Fiber Other Total Discretionary capital expenditures: Communications infrastructure improvements and other capital projects $ 67 $ 570 $ 12 649 $ 62 $ 444 $ 11 $ 517 Purchases of land interests 38 — — 38 25 — — 25 Sustaining capital expenditures 6 15 12 33 5 25 12 42 Total capital expenditures $ 111 $ 585 $ 24 $ 720 $ 92 $ 469 $ 23 $ 584 Components of Interest Expense:
For the Three Months Ended (in millions) June 30, 2023 June 30, 2022 Interest expense on debt obligations $ 205 $ 161 Amortization of deferred financing costs and adjustments on long-term debt 7 7 Capitalized interest (4 ) (3 ) Interest expense and amortization of deferred financing costs, net $ 208 $ 165 Outlook for Components of Interest Expense:
(in millions) Current Full Year 2023 Outlook(b) Previous Full Year 2023 Outlook(c) Interest expense on debt obligations $824 to $854 $804 to $844 Amortization of deferred financing costs and adjustments on long-term debt $20 to $30 $20 to $30 Capitalized interest $(18) to $(8) $(18) to $(8) Interest expense and amortization of deferred financing costs, net $834 to $869 $814 to $859 (a) See our definitions of discretionary capital expenditures and sustaining capital expenditures in this "Non-GAAP Measures and Other Information." (b) As issued on July 19, 2023. (c) As issued on April 19, 2023. Debt Balances and Maturity Dates as of June 30, 2023:
(in millions) Face Value(a) Final Maturity Cash, cash equivalents and restricted cash $ 488 Senior Secured Notes, Series 2009-1, Class A-2(b) 43 Aug. 2029 Senior Secured Tower Revenue Notes, Series 2015-2(c) 700 May 2045 Senior Secured Tower Revenue Notes, Series 2018-2(c) 750 July 2048 Finance leases and other obligations 266 Various Total secured debt $ 1,759 2016 Revolver(d) 679 July 2027 2016 Term Loan A(e) 1,177 July 2027 Commercial Paper Notes(f) 218 July 2023 3.150% Senior Notes 750 July 2023 3.200% Senior Notes 750 Sept. 2024 1.350% Senior Notes 500 July 2025 4.450% Senior Notes 900 Feb. 2026 3.700% Senior Notes 750 June 2026 1.050% Senior Notes 1,000 July 2026 2.900% Senior Notes 750 Mar. 2027 4.000% Senior Notes 500 Mar. 2027 3.650% Senior Notes 1,000 Sept. 2027 5.000% Senior Notes 1,000 Jan. 2028 3.800% Senior Notes 1,000 Feb. 2028 4.800% Senior Notes 600 Sept. 2028 4.300% Senior Notes 600 Feb. 2029 3.100% Senior Notes 550 Nov. 2029 3.300% Senior Notes 750 July 2030 2.250% Senior Notes 1,100 Jan. 2031 2.100% Senior Notes 1,000 Apr. 2031 2.500% Senior Notes 750 July 2031 5.100% Senior Notes 750 May. 2033 2.900% Senior Notes 1,250 Apr. 2041 4.750% Senior Notes 350 May 2047 5.200% Senior Notes 400 Feb. 2049 4.000% Senior Notes 350 Nov. 2049 4.150% Senior Notes 500 July 2050 3.250% Senior Notes 900 Jan. 2051 Total unsecured debt $ 20,824 Net Debt(g) $ 22,095 (a) Net of required principal amortizations. (b) The Senior Secured Notes, 2009-1, Class A-2 principal amortizes over a period ending in August 2029. (c) If the respective series of Tower Revenue Notes are not paid in full on or prior to an applicable anticipated repayment date, then the Excess Cash Flow (as defined in the indenture) of the issuers of such notes will be used to repay principal of the applicable series, and additional interest (of an additional approximately 5% per annum) will accrue on the respective series. The Senior Secured Tower Revenue Notes, 2015-2 and 2018-2 have anticipated repayment dates in 2025 and 2028, respectively. Notes are prepayable at par if voluntarily repaid within eighteen months of maturity; earlier prepayment may require additional consideration. (d) As of June 30, 2023, the undrawn availability under the $7.0 billion 2016 Revolver was $6.3 billion. The Company pays a commitment fee on the undrawn available amount, which as of June 30, 2023 ranged from 0.080% to 0.300%, based on the Company's senior unsecured debt rating, per annum. (e) The 2016 Term Loan A principal amortizes over a period ending in July 2027. (f) As of June 30, 2023, the Company had $1.8 billion available for issuance under its $2.0 billion unsecured commercial paper program. The maturities of the Commercial Paper Notes, when outstanding, may vary but may not exceed 397 days from the date of issue. (g) See further information on, and our definition and calculation of, Net Debt in this "Non-GAAP Measures and Other Information." Cautionary Language Regarding Forward-Looking Statements
This news release contains forward-looking statements and information that are based on our management's current expectations as of the date of this news release. Statements that are not historical facts are hereby identified as forward-looking statements. In addition, words such as "estimate," "see," "anticipate," "project," "plan," "intend," "believe," "expect," "likely," "predicted," "positioned," "continue," "target," "focus," and any variations of these words and similar expressions are intended to identify forward-looking statements. Such statements include our full year 2023 Outlook and plans, projections, expectations and estimates regarding (1) the value of our business model and strategy, (2) operating trends across our business and the impacts therefrom, (3) our dividends, including the timing, growth, and targets relating thereto, and its driving factors, (4) our debt maturities, (5) cash flow growth and the factors driving such growth, (6) revenue growth and its driving factors, (7) AFFO (including on a per share basis) and its components and growth, (8) Organic Contribution to Site Rental Billings (including as Adjusted for Impact of Sprint Cancellations) and its components and growth, (9) site rental revenues and its components and growth, (10) the impact of interest rate increases, (11) our balance sheet, (12) the impact of Sprint Cancellations on our operating and financial results, (13) anticipated cost reductions and charges associated therewith, including timing, amounts, impact and recurrence, (14) the timing of 5G deployment in the US and the opportunities stemming therefrom, (15) towers activity, including potential impacts therefrom on our financial results, (16) services contribution to our Towers business, (17) non-renewals, and (18) the growth in our business and its driving factors. All future dividends are subject to declaration by our board of directors.
Such forward-looking statements are subject to certain risks, uncertainties and assumptions, including prevailing market conditions and the following:
- Our business depends on the demand for our communications infrastructure (including towers, small cells and fiber), driven primarily by demand for data, and we may be adversely affected by any slowdown in such demand. Additionally, a reduction in the amount or change in the mix of network investment by our tenants may materially and adversely affect our business (including reducing demand for our communications infrastructure or services).
- A substantial portion of our revenues is derived from a small number of tenants, and the loss, consolidation or financial instability of any of such tenants may materially decrease revenues, reduce demand for our communications infrastructure and services and impact our dividend per share growth.
- The expansion or development of our business, including through acquisitions, increased product offerings or other strategic growth opportunities, may cause disruptions in our business, which may have an adverse effect on our business, operations or financial results.
- Our Fiber segment has expanded rapidly, and the Fiber business model contains certain differences from our Towers business model, resulting in different operational risks. If we do not successfully operate our Fiber business model or identify or manage the related operational risks, such operations may produce results that are lower than anticipated.
- Failure to timely, efficiently and safely execute on our construction projects could adversely affect our business.
- New technologies may reduce demand for our communications infrastructure or negatively impact our revenues.
- If we fail to retain rights to our communications infrastructure, including the rights to land under our towers and the right-of-way and other agreements related to our small cells and fiber, our business may be adversely affected.
- Our services business has historically experienced significant volatility in demand, which reduces the predictability of our results.
- If radio frequency emissions from wireless handsets or equipment on our communications infrastructure are demonstrated to cause negative health effects, potential future claims could adversely affect our operations, costs or revenues.
- Cybersecurity breaches or other information technology disruptions could adversely affect our operations, business and reputation.
- Our business may be adversely impacted by climate-related events, natural disasters, including wildfires, and other unforeseen events.
- As a result of competition in our industry, we may find it more difficult to negotiate favorable rates on our new or renewing tenant contracts.
- New wireless technologies may not deploy or be adopted by tenants as rapidly or in the manner projected.
- Our focus on and disclosure of our Environmental, Social and Governance position, metrics, strategy, goals and initiatives expose us to potential litigation and other adverse effects to our business.
- We operate in a challenging labor market and failure to attract, recruit and retain qualified and experienced employees could adversely affect our business, operations and costs.
- Our substantial level of indebtedness could adversely affect our ability to react to changes in our business, and the terms of our debt instruments limit our ability to take a number of actions that our management might otherwise believe to be in our best interests. In addition, if we fail to comply with our covenants, our debt could be accelerated.
- We have a substantial amount of indebtedness. In the event we do not repay or refinance such indebtedness, we could face substantial liquidity issues and might be required to issue equity securities or securities convertible into equity securities, or sell some of our assets, possibly on unfavorable terms, to meet our debt payment obligations.
- Sales or issuances of a substantial number of shares of our common stock or securities convertible into shares of our common stock may adversely affect the market price of our common stock.
- Certain provisions of our restated certificate of incorporation, as amended, amended and restated by-laws and operative agreements, and domestic and international competition laws may make it more difficult for a third party to acquire control of us or for us to acquire control of a third party, even if such a change in control would be beneficial to our stockholders.
- If we fail to comply with laws or regulations which regulate our business and which may change at any time, we may be fined or even lose our right to conduct some of our business.
- Future dividend payments to our stockholders will reduce the availability of our cash on hand available to fund future discretionary investments, and may result in a need to incur indebtedness or issue equity securities to fund growth opportunities. In such event, the then current economic, credit market or equity market conditions will impact the availability or cost of such financing, which may hinder our ability to grow our per share results of operations.
- Remaining qualified to be taxed as a Real Estate Investment Trust ("REIT") involves highly technical and complex provisions of the Code. Failure to remain qualified as a REIT would result in our inability to deduct dividends to stockholders when computing our taxable income, thereby increasing our tax obligations and reducing our available cash.
- Complying with REIT requirements, including the 90% distribution requirement, may limit our flexibility or cause us to forgo otherwise attractive opportunities, including certain discretionary investments and potential financing alternatives.
- REIT related ownership limitations and transfer restrictions may prevent or restrict certain transfers of our capital stock.
Should one or more of these or other risks or uncertainties materialize, or should underlying assumptions prove incorrect, actual results may vary materially from those expected. More information about potential risk factors which could affect our results is included in our filings with the SEC. Our filings with the SEC are available through the SEC website at www.sec.gov or through our investor relations website at investor.crowncastle.com. We use our investor relations website to disclose information about us that may be deemed to be material. We encourage investors, the media and others interested in us to visit our investor relations website from time to time to review up-to-date information or to sign up for e-mail alerts to be notified when new or updated information is posted on the site.
As used in this release, the term "including," and any variation thereof, means "including without limitation."
CROWN CASTLE INC.
CONDENSED CONSOLIDATED BALANCE SHEET (UNAUDITED)
(Amounts in millions, except par values)June 30,
2023December 31, 2022 ASSETS Current assets: Cash and cash equivalents $ 276 $ 156 Restricted cash 207 166 Receivables, net 496 593 Prepaid expenses 182 102 Deferred site rental receivables 117 127 Other current assets 71 73 Total current assets 1,349 1,217 Deferred site rental receivables 2,128 1,954 Property and equipment, net 15,571 15,407 Operating lease right-of-use assets 6,385 6,526 Goodwill 10,085 10,085 Site rental contracts and tenant relationships 3,329 3,535 Other intangible assets, net 59 61 Other assets, net 136 136 Total assets $ 39,042 $ 38,921 LIABILITIES AND EQUITY Current liabilities: Accounts payable $ 240 $ 236 Accrued interest 219 183 Deferred revenues 793 736 Other accrued liabilities 312 407 Current maturities of debt and other obligations 819 819 Current portion of operating lease liabilities 342 350 Total current liabilities 2,725 2,731 Debt and other long-term obligations 21,599 20,910 Operating lease liabilities 5,750 5,881 Other long-term liabilities 1,922 1,950 Total liabilities 31,996 31,472 Commitments and contingencies Stockholders' equity: Common stock, 0.01 par value; 1,200 shares authorized; shares issued and outstanding: June 30, 2023—434 and December 31, 2022—433 4 4 Additional paid-in capital 18,202 18,116 Accumulated other comprehensive income (loss) (5 ) (5 ) Dividends/distributions in excess of earnings (11,155 ) (10,666 ) Total equity 7,046 7,449 Total liabilities and equity $ 39,042 $ 38,921 CROWN CASTLE INC.
CONDENSED CONSOLIDATED STATEMENT OF OPERATIONS (UNAUDITED)
(Amounts in millions, except per share amounts)Three Months Ended June 30, Six Months Ended June 30, 2023 2022 2023 2022 Net revenues: Site rental $ 1,728 $ 1,567 $ 3,352 $ 3,143 Services and other 139 167 288 333 Net revenues 1,867 1,734 3,640 3,476 Operating expenses: Costs of operations:(a) Site rental 424 402 839 798 Services and other 98 112 202 225 Selling, general and administrative 210 190 405 371 Asset write-down charges 22 9 22 23 Acquisition and integration costs 1 1 1 1 Depreciation, amortization and accretion 445 427 876 847 Total operating expenses 1,200 1,141 2,345 2,265 Operating income (loss) 667 593 1,295 1,211 Interest expense and amortization of deferred financing costs, net (208 ) (165 ) (410 ) (329 ) Gains (losses) on retirement of long-term obligations — — — (26 ) Interest income 5 — 7 1 Other income (expense) (2 ) (2 ) (4 ) (4 ) Income (loss) before income taxes 462 426 888 853 Benefit (provision) for income taxes (7 ) (5 ) (14 ) (11 ) Net income (loss) $ 455 $ 421 $ 874 $ 842 Net income (loss), per common share: Basic $ 1.05 $ 0.97 $ 2.02 $ 1.95 Diluted $ 1.05 $ 0.97 $ 2.01 $ 1.94 Weighted-average common shares outstanding: Basic 434 433 433 433 Diluted 434 434 434 434 (a) Exclusive of depreciation, amortization and accretion shown separately. CROWN CASTLE INC.
CONDENSED CONSOLIDATED STATEMENT OF CASH FLOWS (UNAUDITED)
(In millions of dollars)Six Months Ended June 30, 2023 2022 Cash flows from operating activities: Net income (loss) $ 874 $ 842 Adjustments to reconcile net income (loss) to net cash provided by (used for) operating activities: Depreciation, amortization and accretion 876 847 (Gains) losses on retirement of long-term obligations — 26 Amortization of deferred financing costs and other non-cash interest 14 7 Stock-based compensation expense, net 91 83 Asset write-down charges 22 23 Deferred income tax (benefit) provision 1 1 Other non-cash adjustments, net 2 3 Changes in assets and liabilities, excluding the effects of acquisitions: Increase (decrease) in liabilities (35 ) (232 ) Decrease (increase) in assets (120 ) (263 ) Net cash provided by (used for) operating activities 1,725 1,337 Cash flows from investing activities: Capital expenditures (720 ) (584 ) Payments for acquisitions, net of cash acquired (89 ) (15 ) Other investing activities, net 3 (10 ) Net cash provided by (used for) investing activities (806 ) (609 ) Cash flows from financing activities: Proceeds from issuance of long-term debt 2,347 748 Principal payments on debt and other long-term obligations (39 ) (36 ) Purchases and redemptions of long-term debt — (1,274 ) Borrowings under revolving credit facility 2,113 2,050 Payments under revolving credit facility (2,739 ) (1,565 ) Net borrowings (repayments) under commercial paper program (1,024 ) 687 Payments for financing costs (23 ) (8 ) Purchases of common stock (29 ) (63 ) Dividends/distributions paid on common stock (1,364 ) (1,287 ) Net cash provided by (used for) financing activities (758 ) (748 ) Net increase (decrease) in cash, cash equivalents and restricted cash 161 (20 ) Effect of exchange rate changes on cash — — Cash, cash equivalents and restricted cash at beginning of period 327 466 Cash, cash equivalents and restricted cash at end of period $ 488 $ 446 Supplemental disclosure of cash flow information: Interest paid 367 324 Income taxes paid (refunded) 10 9 CROWN CASTLE INC.
SEGMENT OPERATING RESULTS (UNAUDITED)
(In millions of dollars)SEGMENT OPERATING RESULTS Three Months Ended June 30, 2023 Three Months Ended June 30, 2022 Towers Fiber
OtherConsolidated Total Towers Fiber
OtherConsolidated Total Segment site rental revenues $ 1,080 $ 648 $ 1,728 $ 1,078 $ 489 $ 1,567 Segment services and other revenues 124 15 139 164 3 167 Segment revenues 1,204 663 1,867 1,242 492 1,734 Segment site rental costs of operations 243 171 414 232 162 394 Segment services and other costs of operations 92 3 95 107 2 109 Segment costs of operations(a)(b) 335 174 509 339 164 503 Segment site rental gross margin(c) 837 477 1,314 846 327 1,173 Segment services and other gross margin(c) 32 12 44 57 1 58 Segment selling, general and administrative expenses(b) 30 51 81 28 46 74 Segment operating profit(c) 839 438 1,277 875 282 1,157 Other selling, general and administrative expenses(b) $ 88 88 $ 79 79 Stock-based compensation expense, net 50 50 44 44 Depreciation, amortization and accretion 445 445 427 427 Interest expense and amortization of deferred financing costs, net 208 208 165 165 Other (income) expenses to reconcile to income (loss) before income taxes(d) 24 24 16 16 Income (loss) before income taxes $ 462 $ 426 (a) Exclusive of depreciation, amortization and accretion shown separately. (b) Segment costs of operations exclude (1) stock-based compensation expense, net of $9 million and $7 million for the three months ended June 30, 2023 and 2022, respectively, and (2) prepaid lease purchase price adjustments of $4 million for each of the three months ended June 30, 2023 and 2022. Segment selling, general and administrative expenses and other selling, general and administrative expenses exclude stock-based compensation expense, net of $41 million and $37 million for the three months ended June 30, 2023 and 2022, respectively. (c) See "Non-GAAP Measures and Other Information" for a discussion and our definitions of segment site rental gross margin, segment services and other gross margin and segment operating profit. (d) See condensed consolidated statement of operations for further information. SEGMENT OPERATING RESULTS Six Months Ended June 30, 2023 Six Months Ended June 30, 2022 Towers Fiber Other Consolidated Total Towers Fiber Other Consolidated Total Segment site rental revenues $ 2,161 $ 1,191 $ 3,352 $ 2,153 $ 990 $ 3,143 Segment services and other revenues 270 18 288 327 6 333 Segment revenues 2,431 1,209 3,640 2,480 996 3,476 Segment site rental costs of operations 477 343 820 458 323 781 Segment services and other costs of operations 191 5 196 216 4 220 Segment costs of operations(a)(b) 668 348 1,016 674 327 1,001 Segment site rental gross margin(c) 1,684 848 2,532 1,695 667 2,362 Segment services and other gross margin(c) 79 13 92 111 2 113 Segment selling, general and administrative expenses(b) 61 100 161 56 93 149 Segment operating profit(c) 1,702 761 2,463 1,750 576 2,326 Other selling, general and administrative expenses(b) $ 170 170 $ 153 153 Stock-based compensation expense, net 91 91 83 83 Depreciation, amortization and accretion 876 876 847 847 Interest expense and amortization of deferred financing costs, net 410 410 329 329 Other (income) expenses to reconcile to income (loss) before income taxes(d) 28 28 61 61 Income (loss) before income taxes $ 888 $ 853 (a) Exclusive of depreciation, amortization and accretion shown separately. (b) Segment costs of operations exclude (1) stock-based compensation expense, net of $17 million and $14 million for the six months ended June 30, 2023 and 2022, respectively, and (2) prepaid lease purchase price adjustments of $8 million for each of the six months ended June 30, 2023 and 2022, respectively. Segment selling, general and administrative expenses and other selling, general and administrative expenses exclude stock-based compensation expense, net of $74 million and $69 million for the six months ended June 30, 2023 and 2022, respectively. (c) See "Non-GAAP Measures and Other Information" for a discussion and our definitions of segment site rental gross margin, segment services and other gross margin and segment operating profit. (d) See condensed consolidated statement of operations for further information. Contacts: Dan Schlanger, CFO Kris Hinson, VP Corp Finance & Treasurer Crown Castle Inc. 713-570-3050 Photos accompanying this announcement are available at:
https://www.globenewswire.com/NewsRoom/AttachmentNg/c45e7370-0ee5-4cb4-b2f0-72913c53eecd
https://www.globenewswire.com/NewsRoom/AttachmentNg/3a2c54f8-c2dd-4253-8bf4-192189c40b30


Chart 1
Crown Castle International Corp.
Chart 2
Crown Castle International Corp.